Prime Day has always been a big day for Amazon Sellers to get right.
Here we break down the data for Prime Day 2018 so you can compare your own performance against the larger market. This can help you hone your strategy for 2019.
Methodology
This analysis looks at a random sampling of about 1,200 anonymized accounts on the Prestozon platform.
- ~800 accounts from North America
- ~400 accounts from Europe
- All accounts had >1,000 impressions/day
- High volume outliers were removed to give an accurate representation of medium-sized accounts
We’ll look at each important metric along with time series charts for each, including ACOS, conversion rate, clicks, sales, spend, and cost per click (CPC).
ACOS
ACOS plummeted on Prime Day in both the US and Europe, and stayed low for the following day. The following day it hits the highest level in two months in the US, while in the Europe it was just back to about normal. Both regions saw a rising ACOS over the following two weeks.
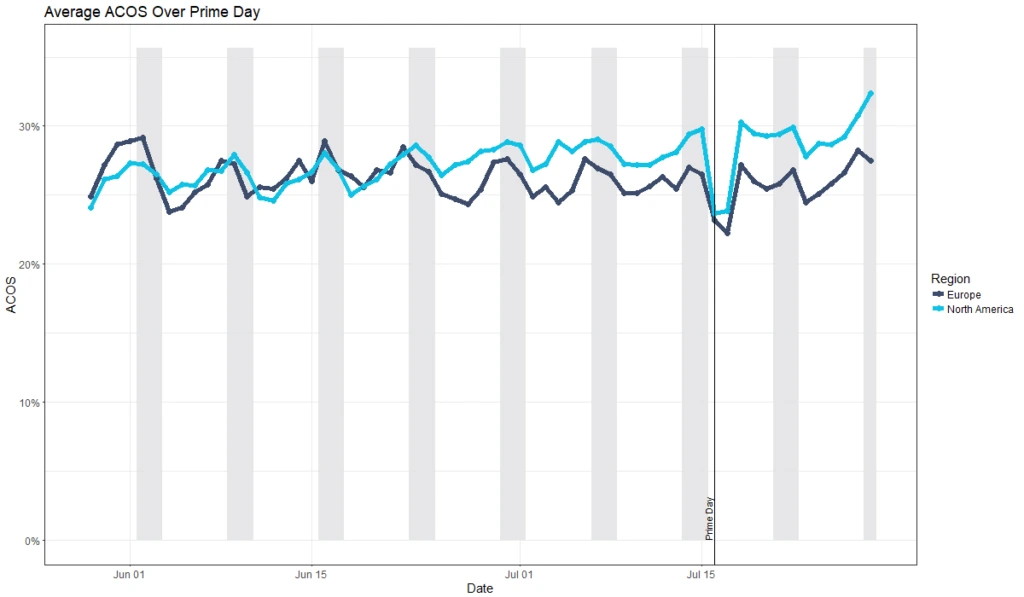
We hypothesize that ACOS kept rising after Prime Day because people forgot to reduce their bids and budgets after Prime Day was over, but this is speculation.
Why did ACOS go down on Prime Day? Mostly because of high conversion rates, which we will look at next.
Conversion Rate
Conversion rates jumped by a similar amount. Both on Prime Day and the day after. The day after Prime Day, in fact, saw an even higher conversion rate in both the US and Europe.
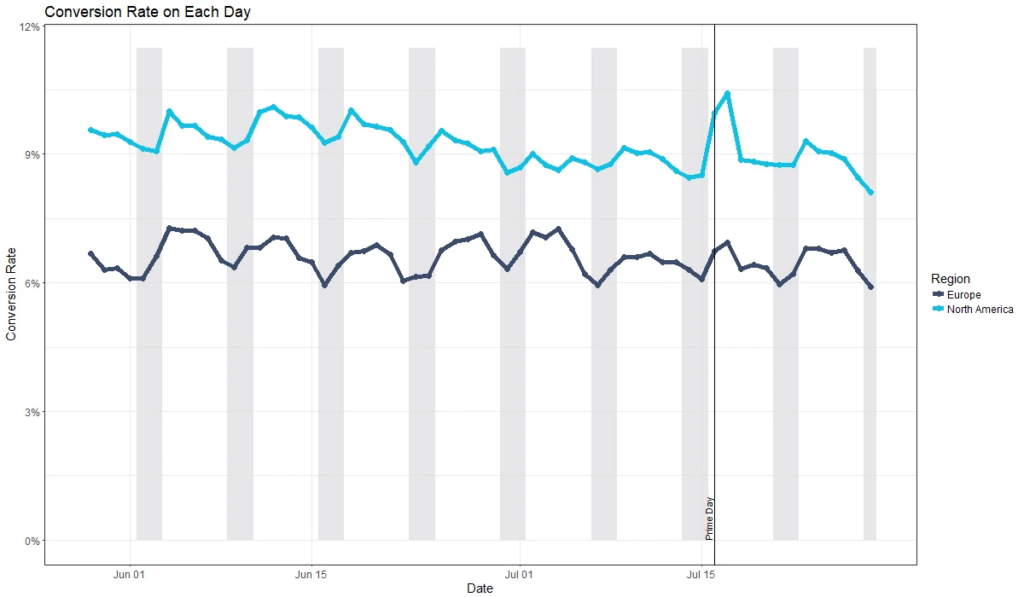
It’s interesting to note that Prime Day in Europe was much less pronounced than in the US – it looks like a normal fluctuation in conversion rates. The same is true to a lesser degree for ACOS in Europe.
Looking at the larger trends, summer seems to be a time of increasing ACOS and decreasing conversion rate, which may shed on light on why Amazon chooses mid July for Prime Day each year.
Clicks
Turning our attention to clicks, we see even more activity. Clicks spiked on Prime Day and the day after, illustrating the high level of customer interest and activity with all the deals and the press coverage. Again, we see a lesser impact in Europe though still substantial.
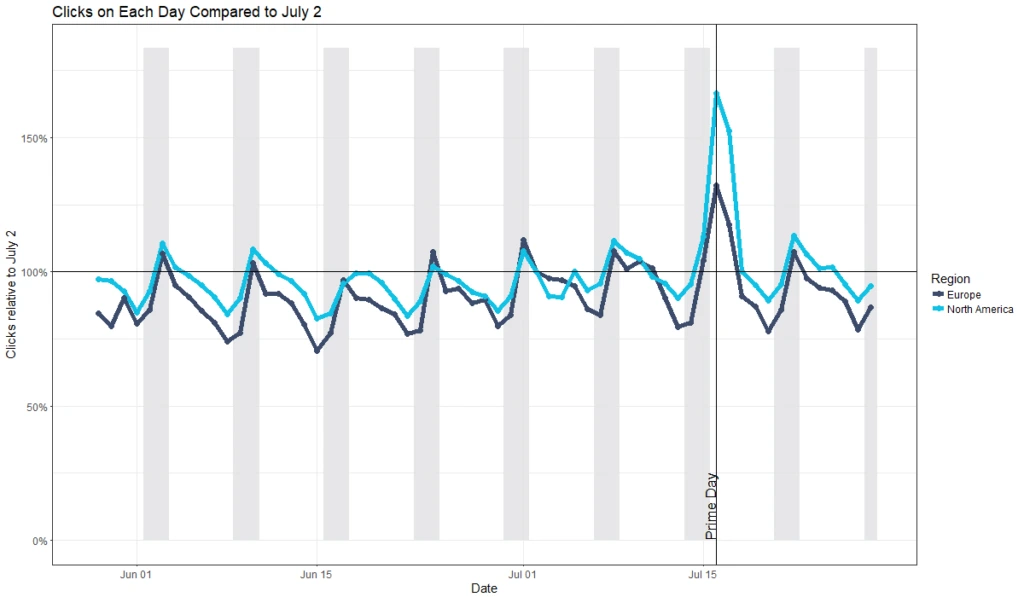
This and the following charts are normalized plots, meaning we are comparing each day to a normal day to easily see changes in the metrics. We chose to compare to July 2 because it was a normal Monday far enough away from Prime day to not be impacted by advertisers’ strategy but close enough to likely have similar shopping behavior from buyers.
Sales
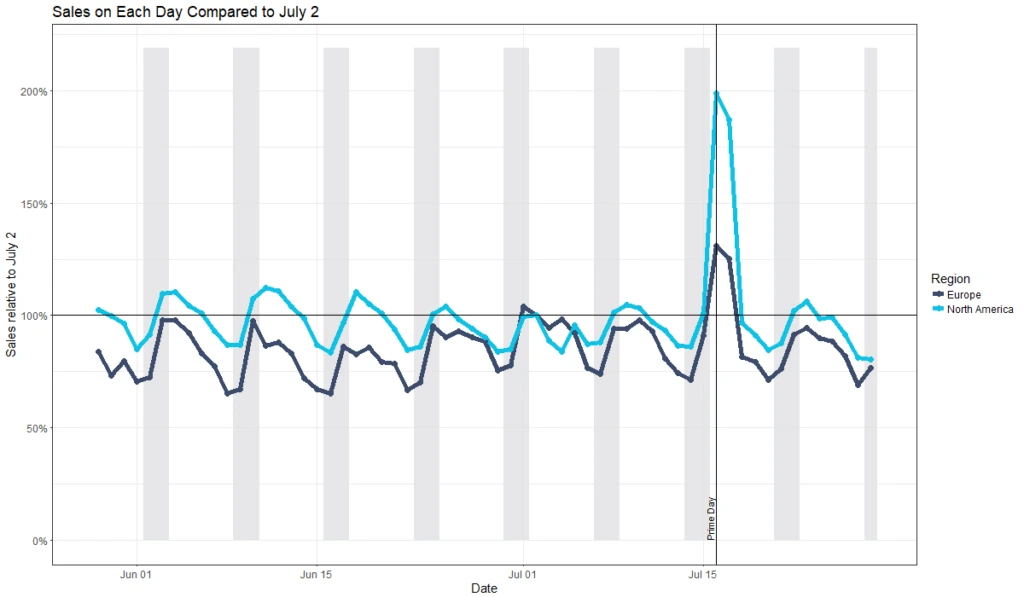
Sales show a similar pattern – greatly increased sales during Prime Day and the following day, and a return to normal after. North American sellers saw 2x the sales on Prime Day than they did the Monday 2 weeks prior!
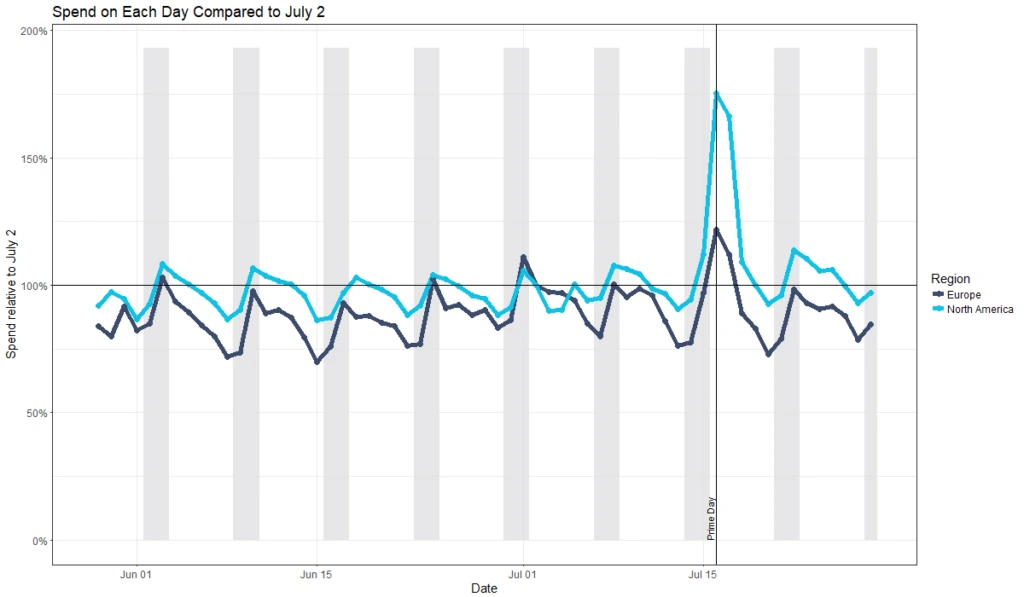
Spend
Same story with spend – ad spend was way up on Prime Day in the US and to a lesser degree, Europe. And spend went up less than sales, which makes sense given the decrease in ACOS we saw above.
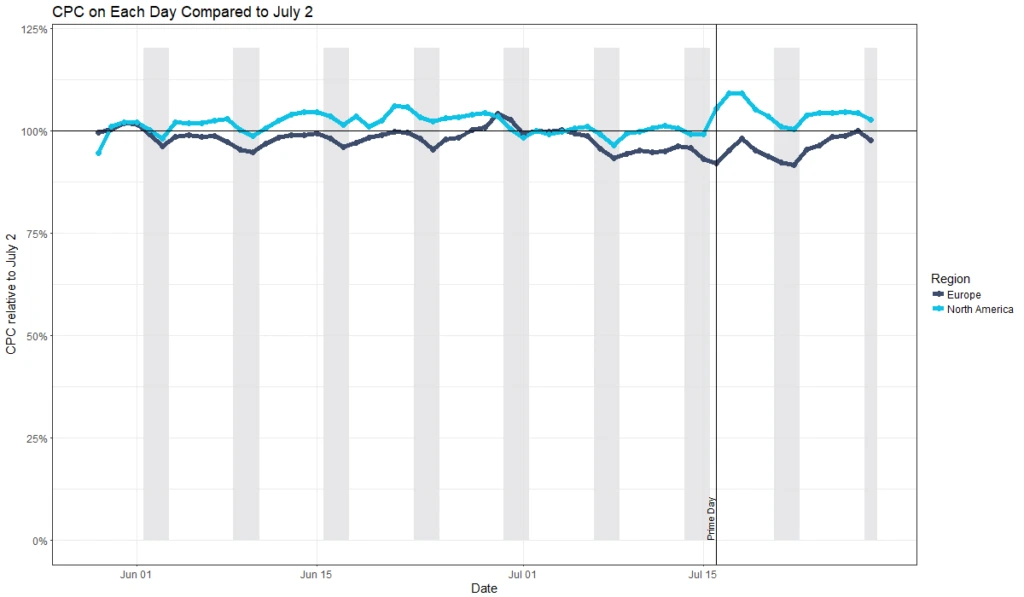
Cost Per Click (CPC)
Finally, CPC saw a jump in the US but perhaps less substantial than you’d think. And in Europe, CPC actually decreased lower than it had been in weeks!
Conclusion
It is useful to know how performance shifts around Prime Day so you can be prepared for next year to get the most out of your ad spend.
Feel free to share this analysis, we hope it’s helpful!
Original post from Prime Day 2018 Data Review -Helium 10