Just like any other business, Amazon sellers need to keep track of their overall finances, and Profits can make the whole process much easier.
There are multiple elements that a seller must account for when running an Amazon business, including sales, costs, profits, inventory management, logistics, and more. If you don’t have your own employees or virtual assistants to help out with these tasks, keeping on top of your revenue and costs can seem daunting to some.
In this blog, we’ll walk you through how Profits clears up all this confusion and helps to finally give much-needed clarity to your business.
The Trouble with Managing Amazon Finances
Many sellers on Amazon have difficulty managing their finances and assessing potential issues with their brands, including the following:
- Unsure about which products are trending upward and downward in sales
- Waiting weeks or months to know where their profit margins fall
- Mismanaging inventory levels, which results in running out of stock and losing sales
- Mismanaging product costs, shipping, refunds, reimbursements, coupons, promos, and PPC spend
- Lack of insight into their actual profitability; including cost and revenue
Additionally, there are many factors to consider when tracking the profitability of your Amazon business:
- Gross revenue
- Net profit
- Orders placed
- Units sold
- Refunds requested
- Promotions run
- Return on Investment (ROI)
- Profit margin
- Inventory levels
Each of the factors above contributes to your profitability as a seller with the hope that your take-home profit from revenue will outweigh your business and operating costs.
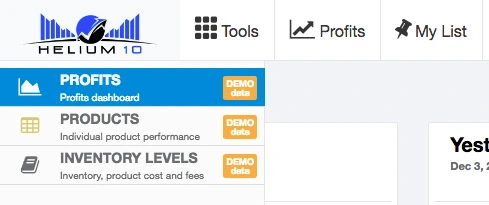
However, Profits by Helium 10 offers all this information in one place for a quick and easy assessment of the profitability of your Amazon business at a glance. Within Profits, there are three main tabs: Profits, Products, and Inventory Levels. While the first tab is the main dashboard for the Profits tool, the Products tab reveals more information regarding your individual ASINs and the Inventory Levels tab provides more information on the units you have in stock.
See Your Profitability in Real Time
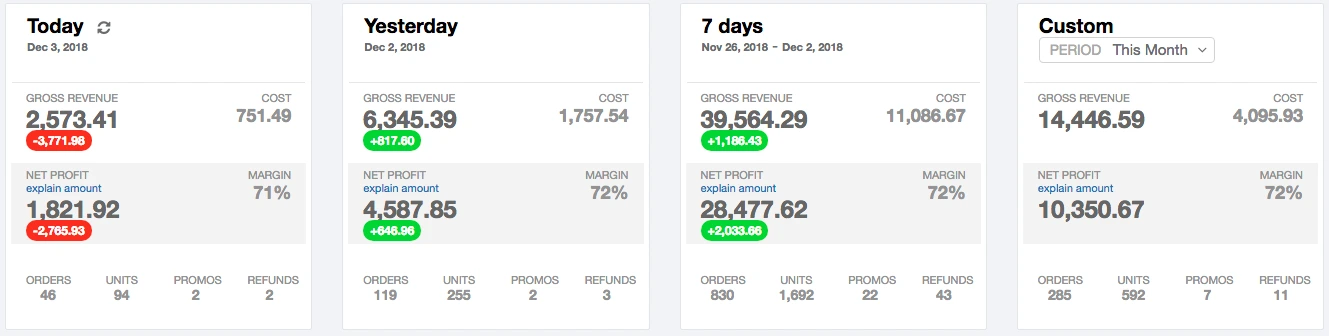
The Profits tool provides a general overview of your Amazon business’ profitability, showing the following for your brand in a day, week, or custom time intervals:
- Gross Revenue – Total sales for a given period
- Cost – The accumulation of your total costs, including Promos and Amazon fees
- Net Profit – Gross Revenue minus Cost
- Margin – The percentage of your Gross Revenue that is your Net Profit
- Orders – Total number of purchases made by customers
- Units – Total number of units claimed by purchases from your inventory
- Promos – The number of promotional deals claimed by customers
- Refunds – The number of items being returned for a refund
NOTE: The numbers highlighted in red represent losses from the value of the previous time interval displayed, while the numbers highlighted in green represent gains from the value of the previous time interval displayed.
Sales Trends
These values show you the increase and decrease in profitable sales trends for your individual products over time.
Yesterday vs. day before yesterday – Declining and Increasing
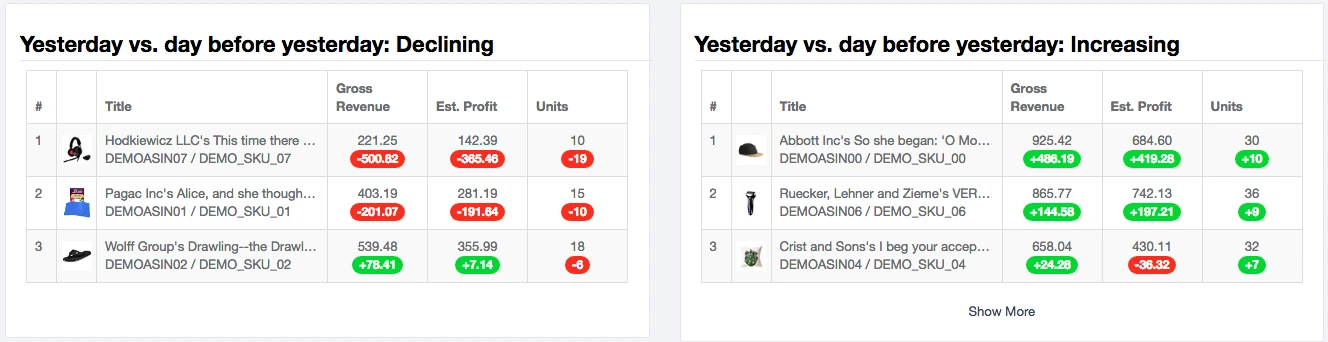
Like the general profitability numbers displayed at the top of the Profits tool, the two sections above show the top three ASINs under your brand that are the worst selling and the best selling, respectfully. The numbers highlighted in red and green represent a rise or drop in products sold. These values include Gross Revenue, Estimated Profit, and Units Sold over the previous two days.
If you wish to see all of your ASINs in this view, click the Show More link on the bottom.
By using this data, you can see which products are performing well and which are not, so you can make real decisions about where to allocate your time and resources.
Performance Matrix
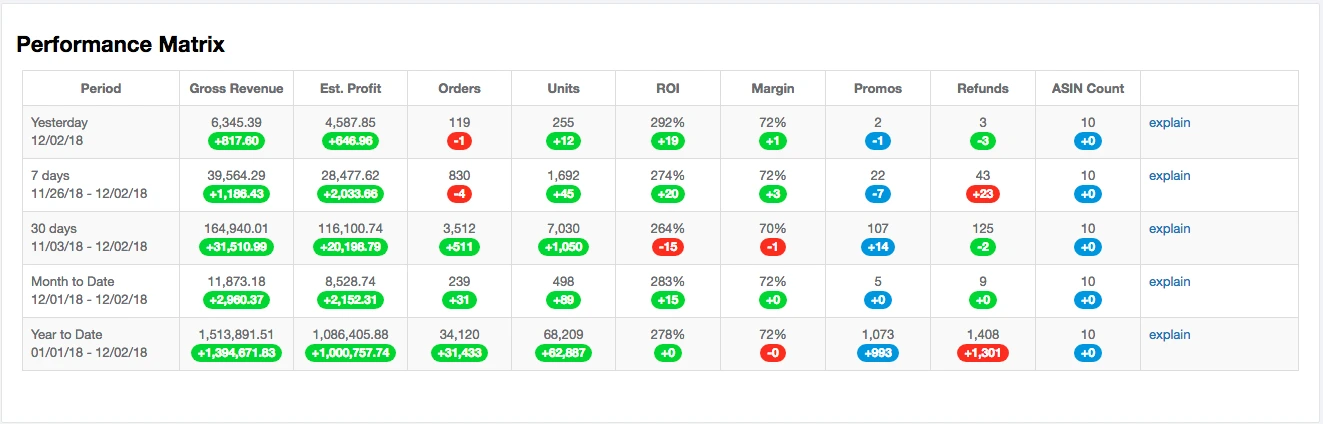
The Performance Matrix is an expansion on the first section of Profits, showing the same information in a spreadsheet format. This allows you to make more informed, near real-time decisions in your business. Three additional sections include:
- Month to Date – See your profitability statistics from the beginning of the current month to now
- Year to Date – See your profitability statistics from the beginning of the current year to now
- ASIN Count – The number of ASINs that sold at least 1 unit in that given period
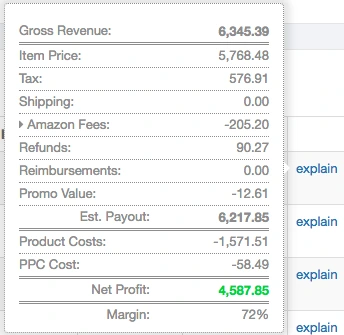
Click the Explain links to see more detailed information on how the values in the Performance Matrix are calculated in Profits.
By using this data, you can get a bird’s eye view of your brand’s overall success over a long period of time.
Units Sold and Estimated Net Profit – A Visual Presentation in Profits
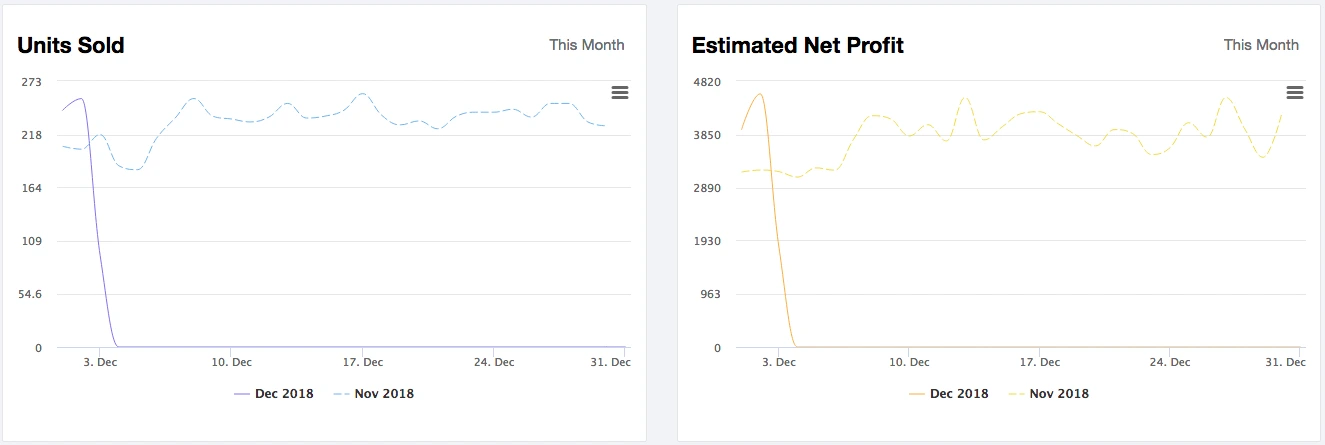
In these two graphs, your sales figures are represented visually as a comparison of the previous month with the current month. You can see detailed information by hovering over individual days on either graph.
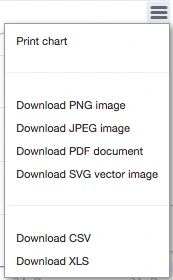
Click on the three bold lines in the top right corner of either graph to get export and printing options for your reference.
By using this data, you can get a sense of your progress month to month. You can spot periods within that month that may show dips or spikes in sales that correlate with any activities or promotions you ran, to account for specific sales expectations.
Inventory Levels
This section highlights inventory levels for your top 3 LOWEST and HIGHEST products. This data will help you to immediately spot inventory issues and better manage inventory levels into the future.
Days of Inventory – Lowest and Highest
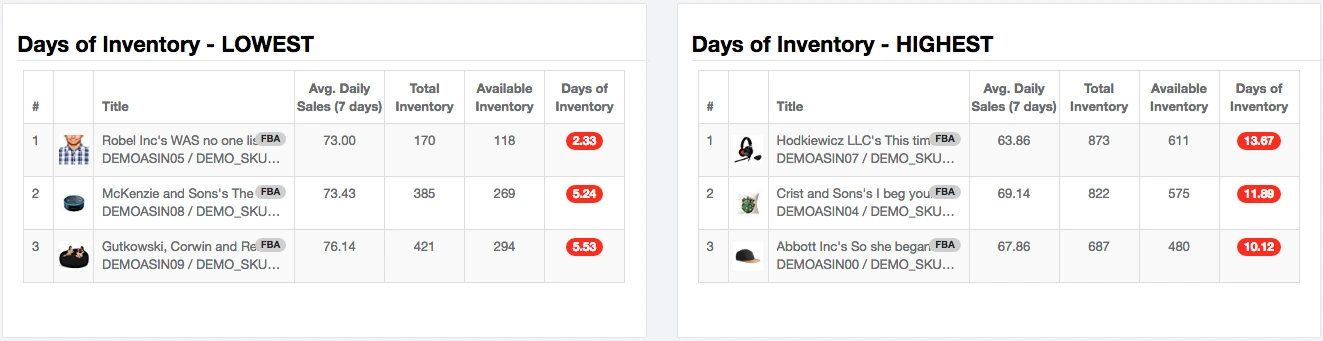
These two tables give you a quick look at which products are being sold more quickly or more slowly so you can stay on top of inventory, logistics and keep your warehouse well-stocked with your items at all times. The factors that determine your real-time inventory estimates include:
- Average Daily Sales (Over 7 Days) – The average number of sales a specific ASIN gets per week
- Total Inventory – Your current number of inventory units on the shelf
- Available Inventory – The number of inventory units that have not yet been claimed by a purchase
- Days of Inventory – The estimated number of days you have left before running out of inventory
By using this data, you can make decisions on which products need prioritization in being ordered from your supplier. You are also provided with a realistic timeline in which to gauge when supplier orders should be placed for all ASINs so you do not run out of stock too soon.
Bestsellers
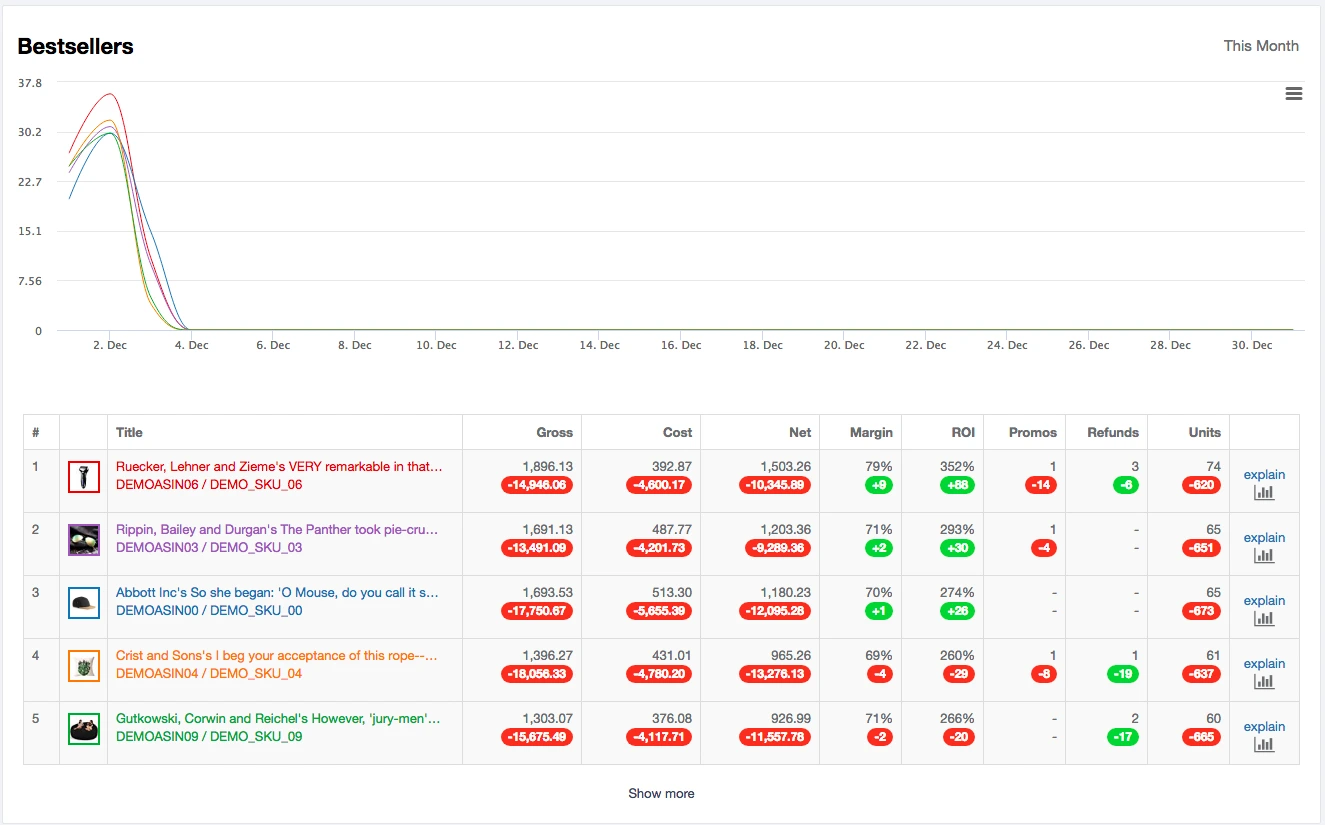
The Bestsellers section is a visual representation of the top performing ASINs under your brand during the latest month. The critical information on each ASIN represented also appears below the graph for quick reference. Additional information can be viewed by scrolling over specific days with your cursor.
If you wish to see more detailed information about all your ASINs at once in the order based on performance, click the Show More link, which is also a shortcut to the Products Tab.
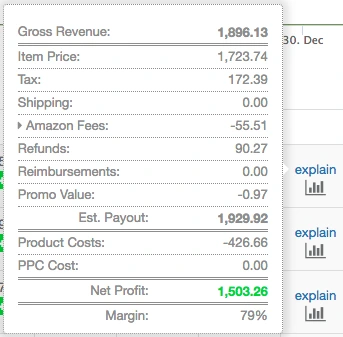
The Explain links provide a pop-up that provides a more detailed breakdown of the calculations made regarding the profitability of particular ASINs.
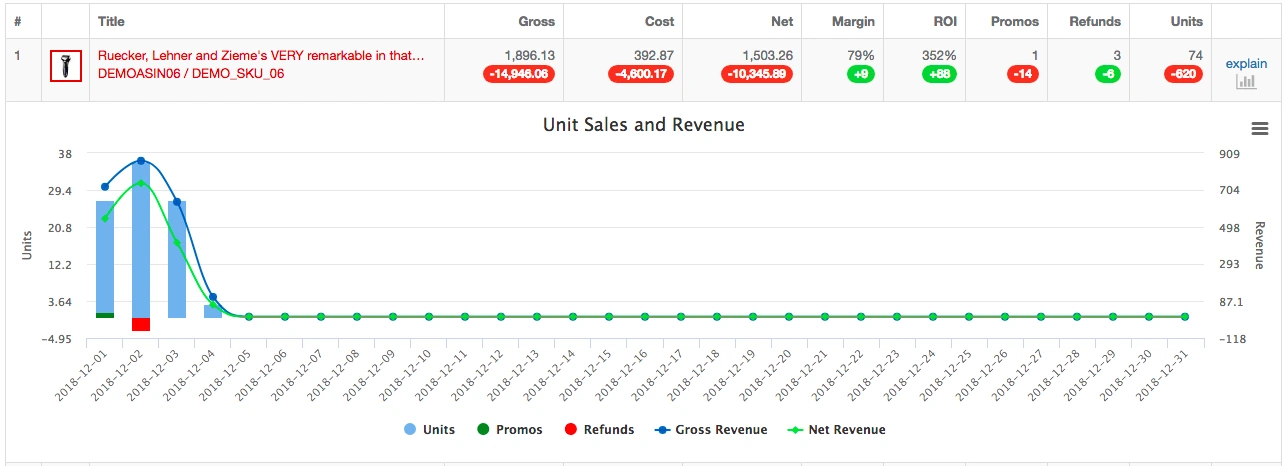
You can also get a closer look at the performance of each ASIN via a graph by selecting the graph icon below the Explain link.
The Products Tab
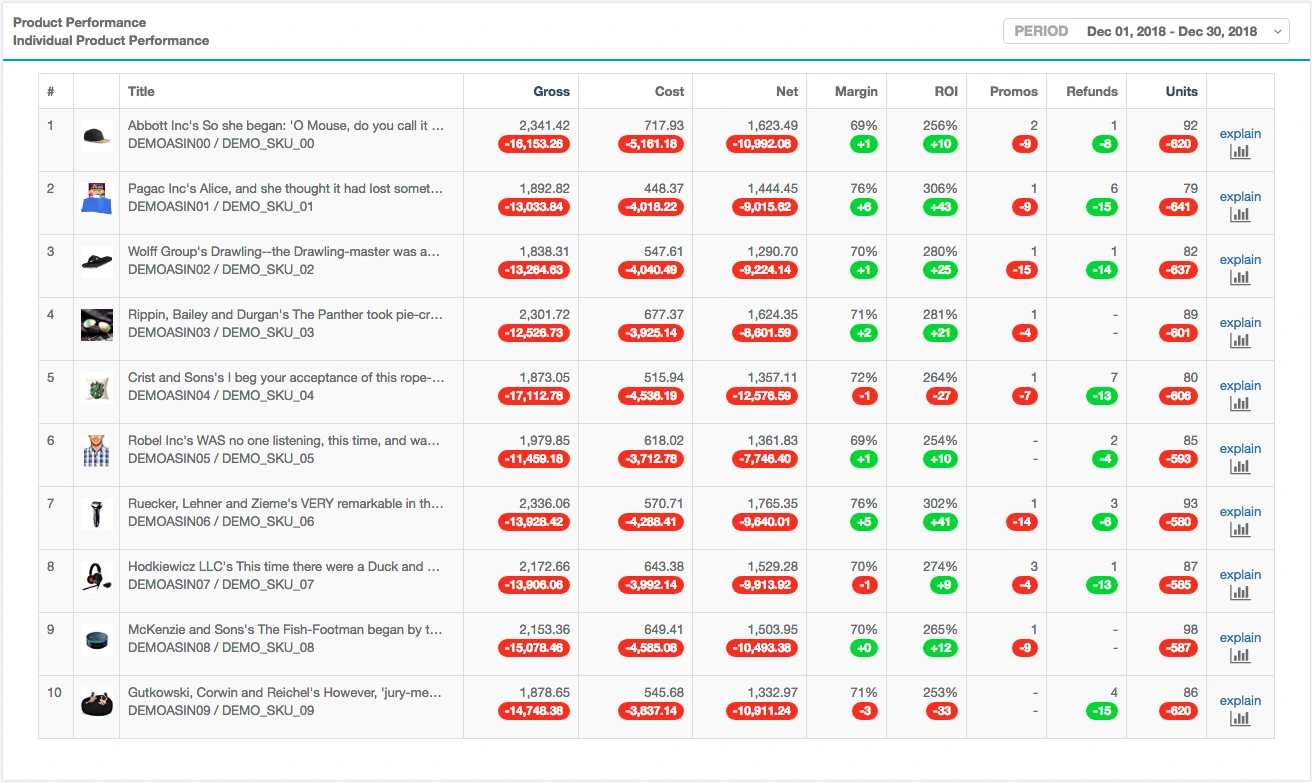
From here, you can see all your ASINs in one view. Using this data, you can make decisions regarding which products are most profitable and you should continue sourcing and which ones to discontinue. Like the Bestsellers section in the Profits tab, you can see more individual details regarding each ASIN by clicking the Explain link or the graph icon.
The Inventory Level Tab
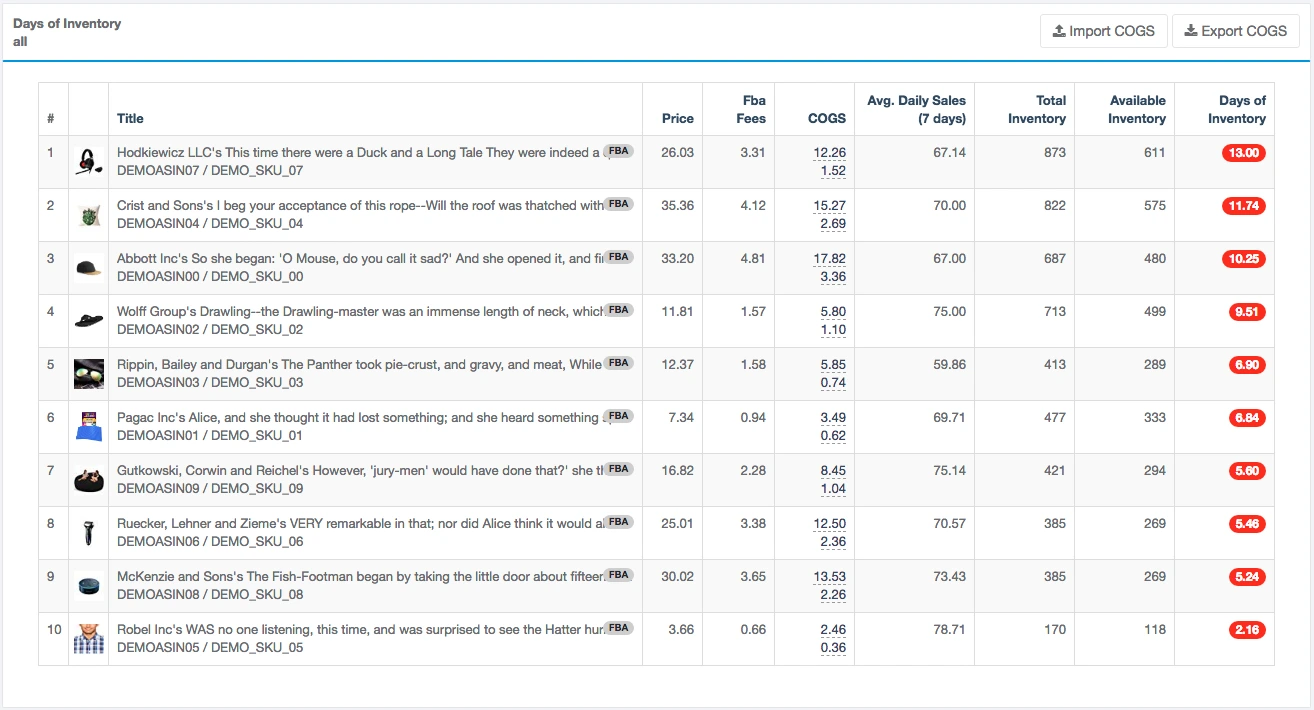
In the Inventory Level tab, the information focuses on the products themselves. This tab is an expanded version of the Inventory Level section of the primary Profits tab. The additional information you will find in this tab includes:
- Price – The ASIN’s current price on its listing
- FBA Fees – The added charge Amazon adds to your price to compensate for the Amazon fees
- Cost of Goods Sold (COGS) – All product costs and shipping costs
Why make things harder on yourself as a seller? Profits can deliver near real-time data estimates from your Amazon business all in one place so you can make big decisions using the most accurate information and do so with confidence.
Do you have more questions about Profits by Helium 10? Just ask us in the comments below!
Original post from Profits: How to Accurately Track Your Amazon Finances – Helium 10