Does 2020 feel like 10 years ago to you too? It is with tentatively optimistic hands that we type this to you now. It has now been roughly two full years since COVID-19 swept the world into isolated pockets of hand sanitizer, impatience, and for many, tragedy.
In Helium 10’s corner of the world, we couldn’t help but notice the sphere of e-commerce wasn’t without its own plague of problems. Supply chain delays and inventory hold-ups brought the industry’s frustrating sides to life. Today, however, we are sticking to what we know (and do) best: uncovering Amazon trends through real-world data.
Fortunately, when you have access to cutting-edge data research tools, unprecedented times also mean unprecedented insights. Over the last two years, Helium 10 has been studying search trends on Amazon to bring you a fascinating report outlining what people were typing inside their search bar while they were stuck inside their homes.
What Are We Looking At?
Having collected two years’ worth of data sourced from Amazon PPC ad clicks and product trends, we’ve compiled the patterns uncovered into a retrospective analysis report.
For the purpose of this analysis, anytime “click demand” is mentioned in this report, it is in reference to the volume of clicks sourced from PPC ads displayed in Amazon.com search results. Analyzing click volume ensures that the user’s intent in performing the search was aligned with the content of the advertisement.
By calculating the percentage increase of total monthly clicks for select, highlighted terms, we can understand month-by-month online interest for certain products and trends. Keep in mind these findings provide insights at a macro level. This data represents total monthly PPC clicks for PPC that contain the highlighted term.
For example, the term “sweatpants” may also include searches for “blue sweatpants,” “cotton sweatpants,” or any other search term that includes “sweatpants.”
Below we have included a preview of selected trends included in the report. For the full analysis and insights into even more keywords, download the complete version below!
By using the above methodology for the highlighted terms below, Helium 10 (and our community) can understand, at a relatively macro level, month-by-month interest online for a certain product or trend.
Here’s (A Sampling Of) What We Found
“Lysol”
Context: The first major wave of COVID-19 hit the US in March and April of 2020, with the country’s first stay-at-home order (California) issued on March 19th.
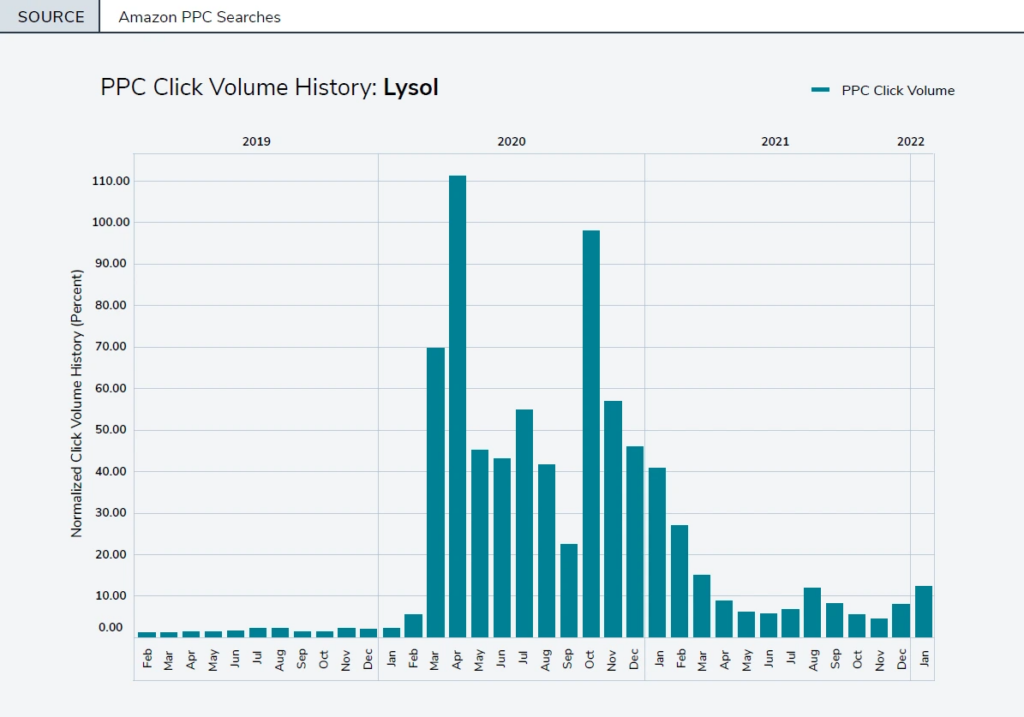
Click demand for “Lysol” hit its peaks (massively – up 7,520% from 2019) in March and April of 2020. You can also see the fall wave of COVID reflected in an additional spike in disinfectant demand come October.
Takeaways: This search term, perhaps more clearly than any other, illustrates the abruptly and severely society changed due to a global pandemic. As click demand mimics sanitary-fueled panic-buying, the keyword “Lysol” precisely mirrors the evolution of the pandemic itself.
“Tiger King”
Context: The Tiger King Netflix documentary was released in March of 2020.
This search term experienced massive spikes in October, with October of 2021 nearly tripling that of 2020. Why in the world did we see a 277% YoY increase in clicks in October between these two years?
(refer to the full report for additional click demand graphs)
Takeaways: Consistent October spikes indicate Tiger King’s popularity as a Halloween costume. Widespread vaccine availability by late 2021 combined with “quarantine fatigue” prompted significantly more people out of their homes and back into their social circles by the time October ‘21 rolled around.
This may very well contribute to the idea of dramatically increased acceptance of the pandemic’s “new norm.”
“Chess”
Context: The Queen’s Gambit series was released on Netflix in October of 2020
(refer to the full report for additional click demand graphs)
As expected with any acutely popular media, we saw a massive spike immediately after release. In fact, November of 2020 showed a 420% increase over November 2019 (back when chess was merely your dad’s idea of a fun Friday night).
Come November of 2021, a full year after the release of The Queen’s Gambit, we can see a significant dip in Amazon PPC searches compared to 2020… but still higher than 2019.
Takeaways: This search term pattern is fascinating in particular because it may indicate the way that modern pop culture phenomena behave over time. After an initial fever pitch (and drop off), lingering, a long-term influence remains.
“Luggage”
Context: Along with local quarantine protocols, several international travel bans began to sweep the world in March 2020 and continue throughout the rest of the year.
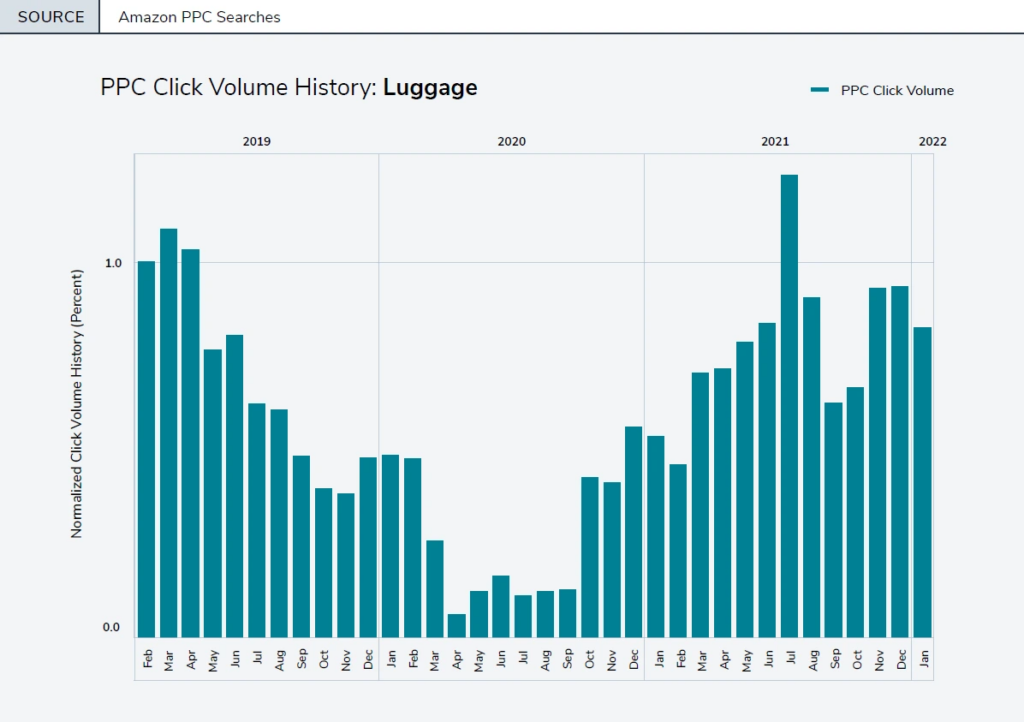
No surprises here. As air travel came to a screeching halt around the world, so did online interest for luggage.
Takeaways: July 2021 is a particularly telling data point, helping paint a picture of a public mutually desperate for a change of scenery. The month saw a 573% increase in clicks for “luggage” compared to the same time one year previous!
“Resistance Bands”
Context: 40 million U.S residents live in apartments with limited space. Resistance bands provide an affordable and portable fitness solution.
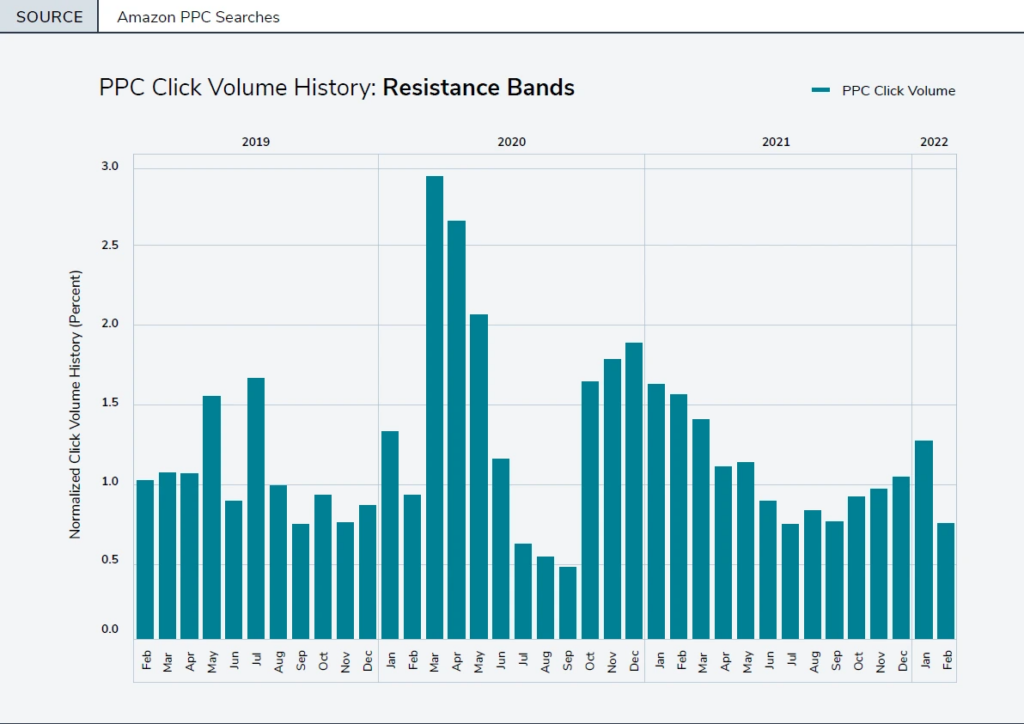
We observed a clear spike in clicks for resistance bands immediately after gyms and fitness studios closed down across the country and people transitioned towards home workouts.
Takeaways: We might hypothesize that the reason resistance bands spiked so much higher than other exercise equipment is that everyone started to work from home, but not everyone wanted to (or could afford to) buy a home gym setup, especially when many were predicting the pandemic to quickly pass. More traditional gym equipment was also likely to be sold out.
Unpack The Full Report, Available Now!
Helium 10’s suite of tools for Amazon and Walmart.com sellers process more than two billion data points each day. We are so excited to bring you a comprehensive report that uses a handful of these data points to illustrate consumer behavior during a time in a world unlike any other. At the end of the day, leveraging accurate insights empowers business decisions for all sellers, regardless of the platform.
Through our robust data capabilities, Helium 10 looks forward to a continued examination of e-commerce trends on Amazon to bring sellers like you the tools you need to thrive as an entrepreneur.